

TEA-CART: A Tool for Making Climate-Smart Transportation Investments
December 5, 2025
Transportation has been the biggest source of climate pollution in the United States for nearly a decade. Every day, state and local transportation agencies make decisions that determine which infrastructure projects get built, and those decisions can have profound implications for the health and well being of our communities and environment.
The transportation infrastructure around us in turn influences our vehicle purchase decisions and which modes of transportation we decide to use when travelling from point A to point B. This isn’t just an environmental issue: transportation-related costs are second only to housing as the biggest expenses for most American households, and lower-carbon transportation options also save consumers money.
Our previous analyses of the Infrastructure Investment and Jobs Act (IIJA) showed that investment decisions by state and local governments could either increase or decrease tailpipe emissions from surface transportation in the U.S. We found that when states prioritize investments in capacity expansion projects (i.e., adding lanes to roadways), this puts upward pressure on emissions. On the other hand, prioritizing roadway maintenance, multi-modal transportation (i.e., transit, bike and pedestrian projects) and vehicle electrification can help to substantially reduce future transportation-related emissions.
While the Trump Administration has reversed course on climate action, federal surface transportation dollars — most of which are apportioned by formula and which states have broad discretion to spend on their own priorities — will likely continue flowing to state and local transportation agencies for the foreseeable future. Furthermore, for every federal dollar a state receives, it typically invests two to five of its own dollars for transportation-related capital investments. Meanwhile, a growing number of states, including Colorado, Minnesota and Hawaii, require their state and local departments of transportation to conduct transportation planning with the explicit goal of reducing associated climate pollution. However, most transportation agencies don’t consider how the billions of dollars in their capital plans could help or harm their ability to meet their emission-reduction targets. One key barrier to action is a lack of available tools for estimating how transportation investments will affect emissions outcomes.
With this in mind, the Georgetown Climate Center partnered with Cambridge Systematics to develop the Transportation Evaluation and Carbon Reduction Tool, or TEA-CART.
How does TEA-CART work?
We developed TEA-CART with two primary goals in mind:
- To make it easier for state transportation decision makers to account for emissions outcomes when considering how to spend transportation dollars in ways that are consistent with achieving state goals to reduce emissions or vehicle-miles traveled (VMT), and
- To make the implications of transportation investment decisions more transparent and understandable to the public.
We believe that helping to achieve these two goals will enable better climate outcomes.
Working with our partners at Cambridge Systematics, we built a free-to-use, publicly-available online tool to help practitioners in state and local DOTs quickly assess how investments in their capital plans could affect the future emissions performance of the transportation system. In order to inform investment decisions early in the planning process, TEA-CART accepts simple inputs that are typically available at the long-range planning or programming phase (e.g., miles of new bike lane, transit buses to be electrified, lane miles of new expanded highway), including during project selection. TEA-CART estimates how different transportation investments will affect future real-world outcomes for people and the environment.
For example, TEA-CART is useful for:
- Calculating how a proposed set of transportation investments might reduce — or increase — greenhouse gas emissions from cars and trucks.
- Estimating how adding, for example, 10 miles of new bike lanes will affect the number of vehicle-miles traveled.
- Comparing the air emissions outcomes of one potential portfolio of investments with another. For example, how much could air pollution be reduced in your community by:
- investing $1 million on electric buses and charging infrastructure? or
- spending those same funds on expanding light rail and transit oriented development?
In addition to serving DOT practitioners, TEA-CART is designed to be readily accessible for a wide range of users, from researchers and transportation planners to community advocates.
To accomplish this, the tool comes with default assumptions pre-loaded. It uses state-specific data wherever possible, otherwise, it uses the best available national data. It is also highly customizable and flexible; most TEA-CART assumptions can be replaced with user-provided data, when available. As outputs, TEA-CART generates baseline inventories and forecasts of transportation emissions; estimates of how new investments could affect future VMT, greenhouse gases and other pollutants; and information on the cost-effectiveness of various project types.
Access TEA-CART
Illustrative Example of TEA-CART in Practice
To help illustrate how TEA-CART works, we generated two investment scenarios, each of which illustrates ways that different portfolios of investments result in different emissions outcomes. Both scenarios are described in greater detail in this companion document, while below is a short description of the BAU — or "business as usual" — scenario.
TEA-CART Inputs: For the BAU scenario, we included $4 billion dollars worth of capital investments over a 5-year period (find more information about this and other examples at the end of this webpage). This example reflects an investment portfolio that is largely consistent with the status quo — or business as usual (BAU) — in a state that is making substantial investments in vehicle electrification strategies.
For this budget scenario — which the user would input using the TEA-CART Budget tab — we assumed the following investments:
- $500M for new Bicycle and Pedestrian infrastructure
- $294M for Transit Fleet Electrification
- $12M for Travel Demand Management
- $59M for Micromobility
- $29M for more efficient Traffic Operations
- $588M for replacing fossil-fueled Medium- or Heavy-Duty Electric Vehicles
- $12M for investments in Park-and-Ride facilitates
- $470M for new or expanded Electric Vehicle Charging Infrastructure
- $235M for Intermodal Freight facilities (enabling a switch from truck- to rail-based freight movement)
- $1,800M for new lane-miles of Roadway Expansion
TEA-CART Outputs: The following graphic (a screenshot from the Strategy Summary tab in TEA-CART) illustrates estimated changes in emissions (in metric tons of carbon dioxide equivalent, or CO2e) at three future, user-selected time horizons, and attributes changes in emissions to each type of investment.
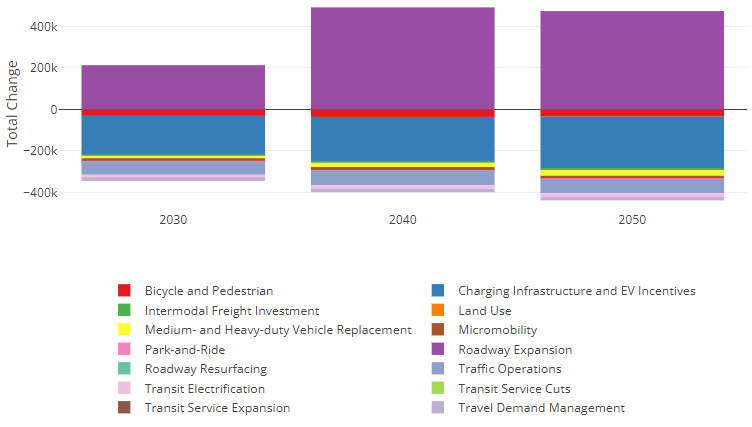
These results show that projected emissions in this simple, so-called “BAU” investment scenario are close to breaking even, i.e., no net change in emissions. In other words, increases in emissions from investments in roadway expansions are projected to roughly offset emission reductions resulting from investments in vehicle electrification and various projects that increase multi-modal transportation options and increase system efficiency.
In addition to graphics like the one shown above, TEA-CART also provides detailed output tables, including estimated changes in emissions for each of the user-defined horizon years (in this case, 2030, 2040 and 2050). Other outputs include changes in emissions of NOx, PM2.5, plus VMT, and daily active trips. Output tables also include estimates for the relative cost-effectiveness of different investment strategies, from a CO2e emissions perspective. It is important to reiterate that TEA-CART is designed to inform planning-stage decision making, before highly specific, project-level information is available. For project-level analysis other tools are available, like the CMAQ Toolkit. Find more information about how TEA-CART works and at the end of this webpage.
Conclusion
The jobs of transportation officials are only getting more complicated and challenging, particularly with the federal government cutting funding and technical assistance for many transportation projects and programs that had been available for state and local governments to use to achieve their climate goals. We developed TEA-CART to serve as a resource to state and local DOTs, to make it easier for them to estimate how emissions outcomes could be affected by the types of investment decisions that they make every day. We hope this tool will also help to catalyze fruitful discussions about how and why public dollars are directed toward investment in certain transportation projects over others.
By more actively accounting for emissions outcomes when deciding how public transportation dollars are spent, state and local governments could provide their residents with more transportation options while helping to reduce costs for households and substantially cut emissions from cars and trucks. TEA-CART could help to inform those decisions, and we invite you to check out the tool to explore all of its many features.
Ready to get started with TEA-CART?
If you’re interested in getting under the hood and trying TEA-CART for yourself, the following resources will help get you started.
Access TEA-CART
Examples of TEA-CART in Practice (PDF)
This short paper shows how to use TEA-CART, including descriptions of inputs for two illustrative investment scenarios, which you can download and try for yourself.
“Starter pack” investment scenarios (try it yourself):
- Download Business as Usual Budget Scenario spreadsheet: TEA-CART-starter_NJ-BAU_updated.xlsx
- Upload this spreadsheet in TEA-CART using the "Upload User Inputs" option
- Download Multi-Modal Budget Scenario spreadsheet: TEA-CART-starter_NJ-multi-modal_updated.xlsx
- Upload this spreadsheet in TEA-CART using the "Upload User Inputs" option