

Implementing Pilots: Best Practices and Tools
Best practices and tools are emerging around the country to create green infrastructure pilot programs that yield the best outcomes. These best practices and tools relate to 1) communication strategies and engagement with both the public and with other governmental partners; 2) Creating local partnerships; and 3) conducting both cost-benefit analysis and tracking pilot project benefits for economic, environmental, and social criteria.
The following section identifies these best practices and tools, and provides examples of jurisdictions that have used them.
Communication and Engagement
Community involvement is vital to implementing successful pilots.See footnote 1 Engagement with the community can be used to tailor projects to meet the needs of residents and decrease the chance of dissatisfaction with the project.See footnote 2 Increased public awareness and satisfaction with green infrastructure projects can lead to increased support for further projects as well as as well as increasing the likelihood that private property owners will install their own green infrastructure, such as rain gardens. Collaborating with partner agencies can spread support for green infrastructure practices across the local government, and can help leverage potential funding streams and manpower for ongoing operations and maintenance. As the benefits of green infrastructure are available more quickly than the benefits for gray, effective communication strategies can relay that information to the public to build support.
Presentations and Workshops: Holding p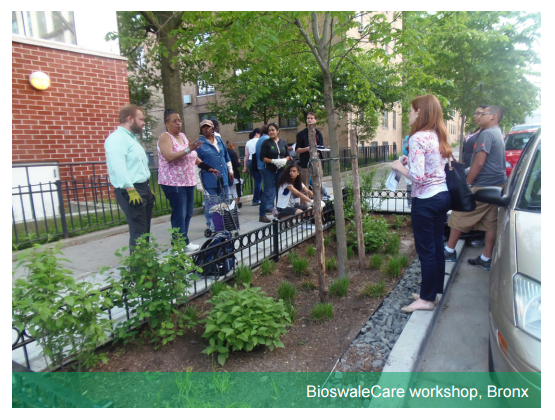 resentations and workshops enables staff to meet individual members of the community and better understand and meet community needs. For example, New York City’s Department of Environmental Protection makes presentations to community boards and other civic and environmental organizations, in addition to elected officials and their staffs, about the city’s Green Infrastructure Program.See footnote 3 Likewise, as part of its 10,000 Rain Gardens Program, Kansas City sponsored “how-to workshops” for private landscaping businesses and municipal employees that explained the initiative and rain gardens, and addressed water quality concerns.See footnote 4 These workshops not only raised awareness but trained contractors and city employees in installation and maintenance techniques.See footnote 5
Media Campaigns: Kansas City engaged in an extensive media campaign involving interviews on television and the radio, as well as advertisements and articles in local newspapers.See footnote 6 These media campaigns reached an estimated three million people in 2007.See footnote 7 In 2013, New York City’s Department of Environmental Protection created an educational video on the Green Infrastructure Program, which described some of the environmental challenges caused by combined sewer overflows as well as some green infrastructure solutions such as green roofs, rain gardens, and permeable pavers.See footnote 8
Websites: In 2013, New York City’s Department of Environmental Protection launched a new website that provides information on the City’s Green Infrastructure Program, including the most common types of green infrastructure practices as well as a map of priority areas. Community members can use the site to see if their neighborhood will receive green infrastructure installations and to better understand the practices. Kansas City’s 10,000 Rain Gardens initiative created a website offering residents and other audiences a clearinghouse of information pertaining to the program and to stormwater management more generally, and was receiving over 100,000 visits per year even after the main media campaign had ended.See footnote 9
Written Materials: Written materials such as brochures and surveys can be effective means of engaging the public and partner agencies about stormwater management practices and the municipality’s use of green infrastructure. For example, New York City’s Department of Environmental Protection developed a brochure that explains the siting and construction process for projects in the right-of-way, answers frequently asked questions, and describes the co-benefits of green infrastructure.See footnote 10 Similarly, Seattle Public Utilities (SPU) used parking surveys to better understand and meet the needs of the community for its Street Edge Alternatives Program. The surveys revealed community concerns about reductions in parking due to reductions in street width caused by the installation of green infrastructure projects. SPU responded to this concern by installing occasional angled parking clustered along the street.See footnote 11
Inter-Agency Partnerships: Creating partnerships between agencies can help to implement green infrastructure practices both efficiently and effectively. By pooling the resources, expertise, and knowledge of different agencies, inter-agency partnerships can be crucial to successful pilot programs. These partnerships can exist to aid in any stage of the process, including planning, installation, maintenance, and monitoring. For example, in New York City, the Departments of Environmental Protection and Parks and Recreation have worked together to develop the Green Infrastructure Maintenance Program in order to allocate appropriate resources for the long-term maintenance of DEP’s green infrastructure projects.See footnote 12
Creating Local Partnerships
Utilizing the resources and expertise of local organizations in both the private and public sectors can increase the efficiency and cost-effectiveness of implementing pilot programs. Cities such as New York and Washington, D.C., use grant programs to strengthen their local partnerships, providing funds and other resources to private property owners to build green infrastructure projects. NYC’s Department of Environmental Protection (DEP) has used local partnerships to help with green infrastructure retrofit projects.See footnote 13 As part of its Schoolyards to Playgrounds program, the DEP has worked with the not-for-profit Trust for Public Land, Department of Parks and Recreation, NYC Department of Education, and NYC School Construction Authority to renovate school playgrounds in an attempt to ensure that all New Yorkers live within a 10-inute walk from a park.See footnote 14
Quantifying Costs and Benefits
Effective engagement with elected officials, partner agencies, and the public requires that proponents of green infrastructure be able to speak to the priorities and concerns of different agencies and interest groups. To do so effectively, proponents need to be able to provide accurate information about the costs of a proposed project and the expected benefits it can create. This information can come from monitoring data on the pilots that have already been constructed, or from available calculators for modeling projected costs and benefits. While specific monitoring techniques will be discussed later in the chapter, the following section provides a number of useful online tools that local governments can use to help calculate and project costs and benefits.
Green Values National Stormwater Management Calculator: developed by The Center for Neighborhood Technology, this online calculator can be used to compare the performance, costs, and benefits of green infrastructure to conventional stormwater practices, as well as to find the appropriate green infrastructure practice for a given location given that location’s site-specific conditions and constraints.
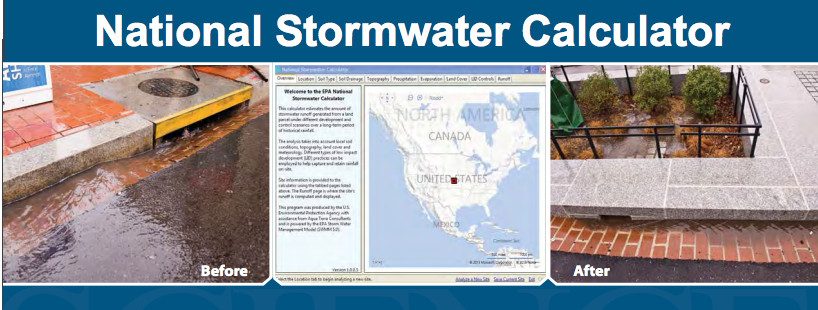 EPA National Stormwater Calculator: developed by the EPA, this desktop application can provide approximations of annual rainwater and runoff frequency from any location in the United States. This information will assist a local government’s determination as to what green infrastructure practices would be most effective and where. With the update of its Climate Adjustment Tool, local governments can now incorporate the effects of climate change into rainwater and runoff projections.
New York City Co-Benefits Calculator: Developed by the New York City Department of Environmental Protection (DEP), the Co-Benefit Calculator is a single comparative tool that calculates the environmental, social, and economic benefits associated with each type of green infrastructure practice, allowing users to compare the costs and benefits of each green infrastructure practice. The metrics that the calculator uses focus on urban heat island mitigation, increased property values, green jobs, and reduced treatment needs, among other things.
Endnotes:
2. City of Chicago. “Complete Streets.” View Source | Back to contentBack to content
4. Water Environment Research Foundation. “Kansas City, MO.” View Source | Back to contentBack to content
8. The video is available at DEP’s YouTube page, at www.youtube.com/ watch?v=zrhw2cMTpJs. Back to contentBack to content
10. City of New York. “NYC Green Infrastructure: 2013 Annual Report.” View Source | Back to contentBack to content
11. National Resource Defense Council. “Rooftops to Rivers II.” Accessed at Rooftops to Rivers II View Source | Back to contentBack to content
12. City of New York. “NYC Green Infrastructure: 2013 Annual Report.” View Source. | Back to contentBack to content
13. City of New York. “NYC Green Infrastructure: 2013 Annual Report.”View Source | Back to contentBack to content
14. Id. Back to contentBack to content
Read Previous Section Read Next Section
Back to top